Documentation Index
Fetch the complete documentation index at: https://flipt-webhook-docs.mintlify.app/llms.txt
Use this file to discover all available pages before exploring further.
Metrics
Flipt exposes Prometheus metrics at the /metrics
HTTP endpoint. To see which metrics are currently supported, point your browser
to FLIPT_HOST/metrics (ex: localhost:8080/metrics).
You should see a bunch of metrics being recorded such as:
flipt_cache_hit_total{cache="memory",type="flag"} 1
flipt_cache_miss_total{cache="memory",type="flag"} 1
---
go_gc_duration_seconds{quantile="0"} 8.641e-06
go_gc_duration_seconds{quantile="0.25"} 2.499e-05
go_gc_duration_seconds{quantile="0.5"} 3.5359e-05
go_gc_duration_seconds{quantile="0.75"} 6.6594e-05
go_gc_duration_seconds{quantile="1"} 0.00026651 go_gc_duration_seconds_sum
0.000402094 go_gc_duration_seconds_count 5
Dashboards
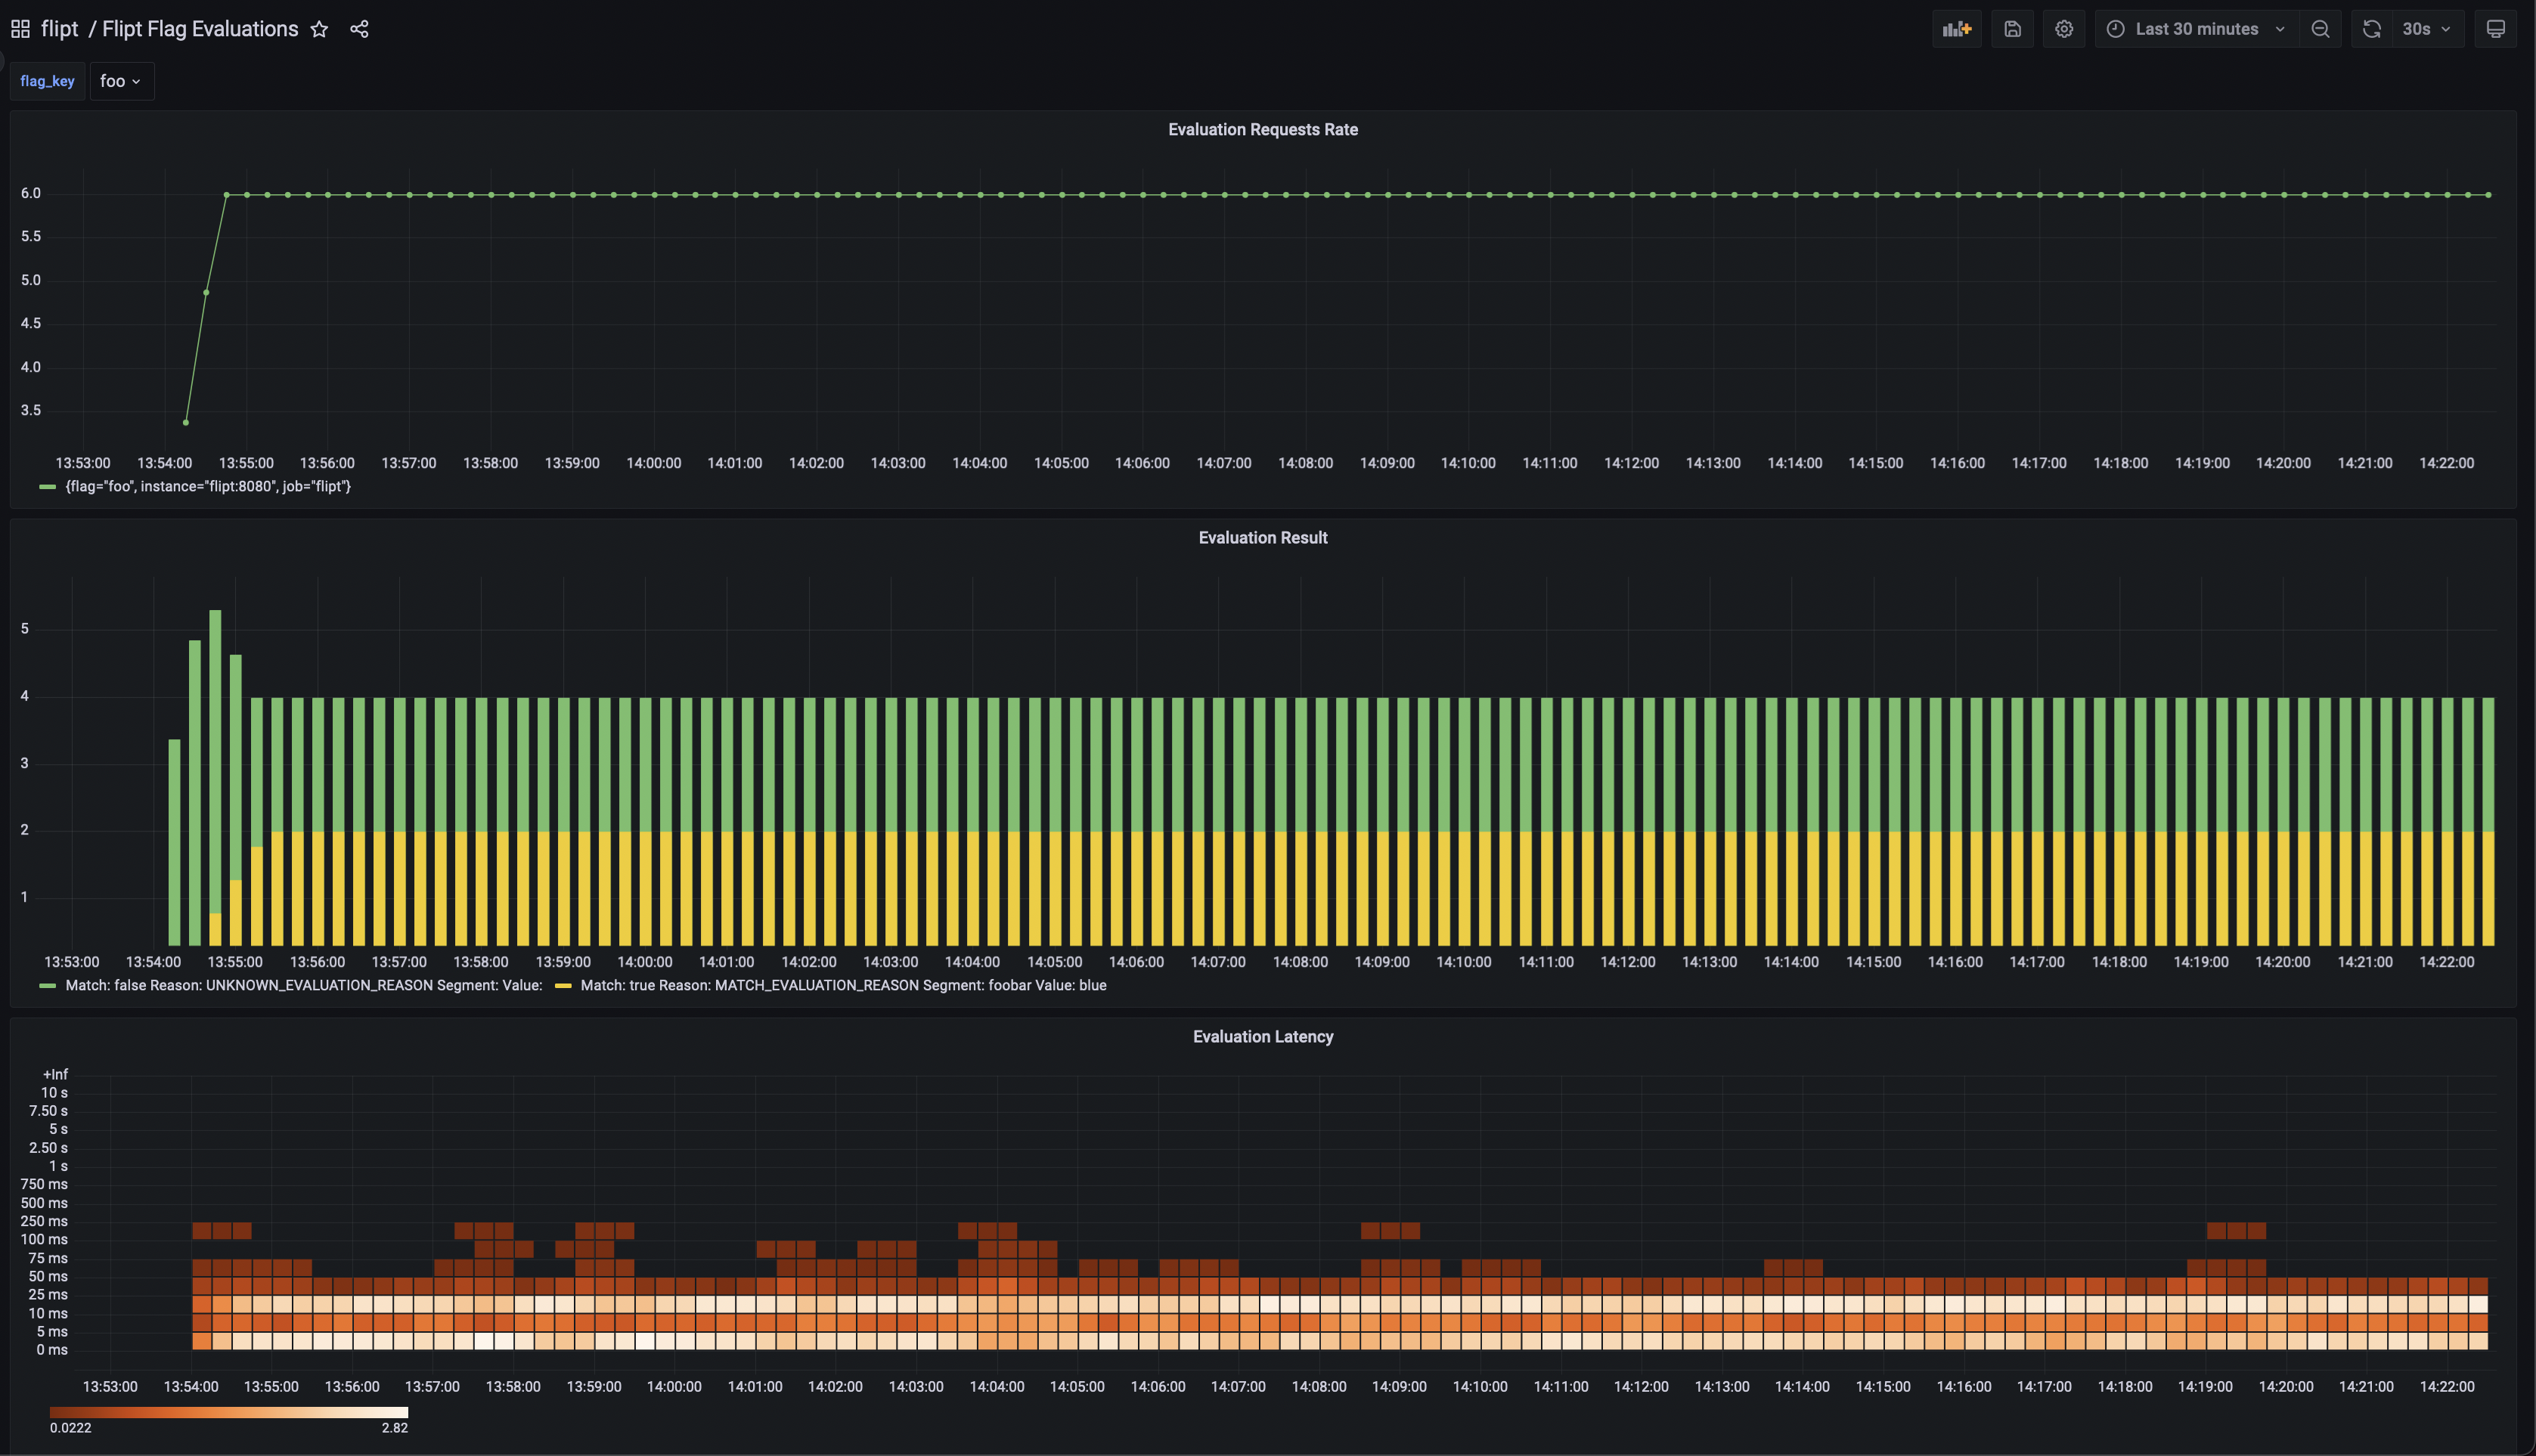 We provide a set of Grafana dashboards that you can use to visualize the metrics collected by Flipt, including both server health and flag evaluation metrics.
You can find the dashboards in our grafana-dashboards repository.
We provide a set of Grafana dashboards that you can use to visualize the metrics collected by Flipt, including both server health and flag evaluation metrics.
You can find the dashboards in our grafana-dashboards repository.
Logging
Flipt writes logs to STDOUT in two formats:
The format can be configured via the log.encoding configuration option.
For production deployments, we recommend using the JSON format as it’s easier to parse and ingest into log aggregation systems such as Elasticsearch, Splunk, Loki, or DataDog.
We’ve prepared an example showing how to set up Flipt with Grafana Loki and Promtail to ingest and query logs.
JSON
{
  "L": "INFO",
  "T": "2024-01-20T21:59:49-05:00",
  "M": "finished unary call with code OK",
  "server": "grpc",
  "grpc.start_time": "2024-01-20T21:59:49-05:00",
  "system": "grpc",
  "span.kind": "server",
  "grpc.service": "flipt.evaluation.EvaluationService",
  "grpc.method": "Boolean",
  "peer.address": "127.0.0.1:52635",
  "grpc.code": "OK",
  "grpc.time_ms": 0.146
}
Console
2024-01-20T22:04:18-05:00 INFO finished unary call with code OK {"server": "grpc", "grpc.start_time": "2024-01-20T22:04:18-05:00", "system": "grpc", "span.kind": "server", "grpc.service": "flipt.evaluation.EvaluationService", "grpc.method": "Boolean", "peer.address": "127.0.0.1:53714", "grpc.code": "OK", "grpc.time_ms": 0.373}
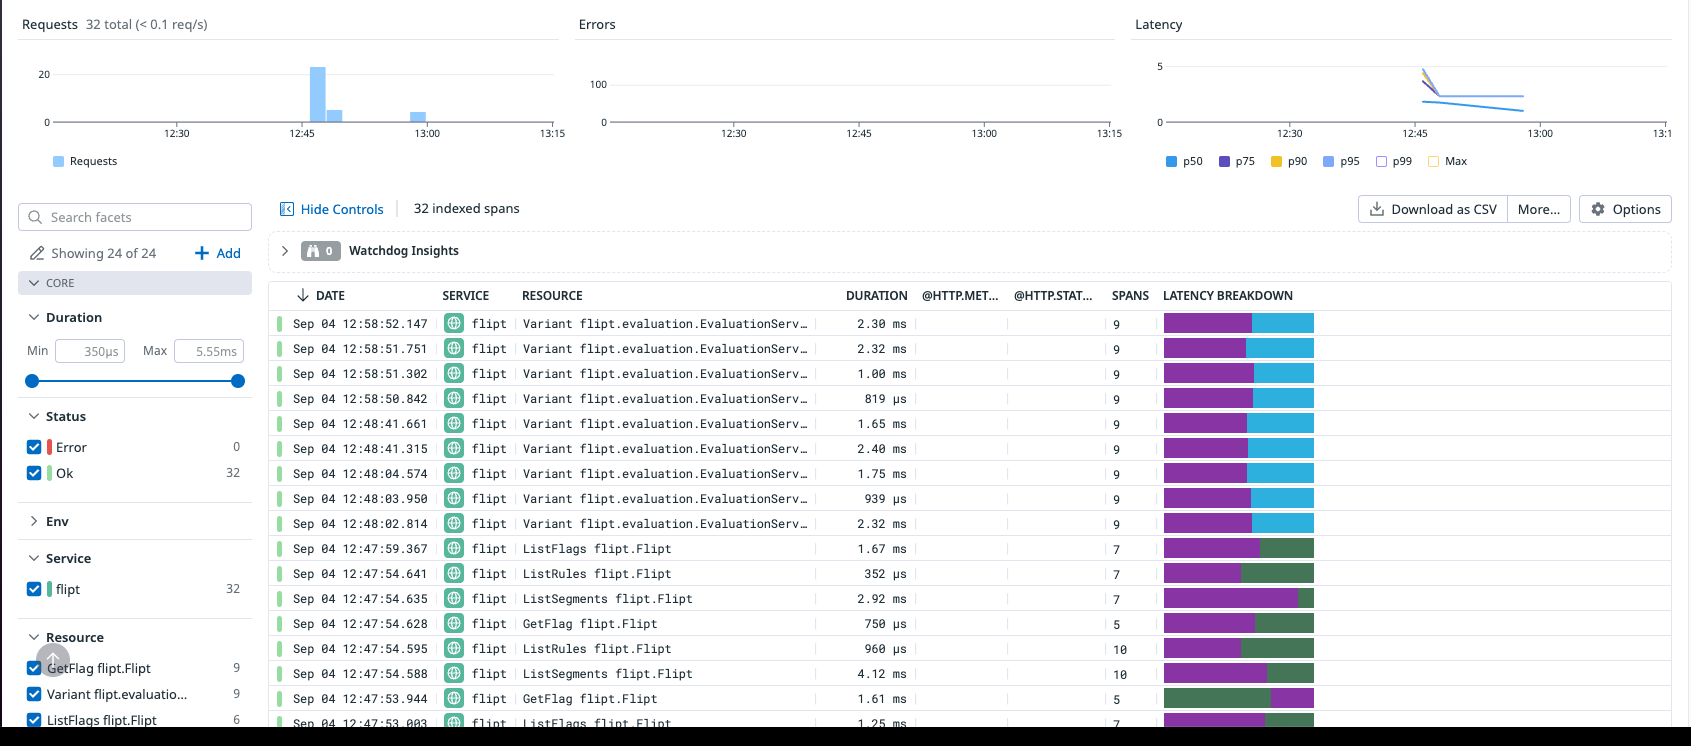
Tracing
Flipt supports distributed tracing via the OpenTelemetry project.
Currently, we support the following tracing backends:
Enable tracing via the values described in the Tracing configuration and point Flipt to your configured collector to record spans.
Examples showing how to set up Flipt with each of the supported tracing backends can be found in the main GitHub repository .
OTLP
 OTLP supports additional configuration such as specifying the protocol to use (gRPC or HTTP) as well as providing custom headers to send with the request.
Custom headers can be used to provide authentication information to the collector which may be required if you are using a hosted collector such as NewRelic, DataDog, or Honeycomb.
These can be configured via the
OTLP supports additional configuration such as specifying the protocol to use (gRPC or HTTP) as well as providing custom headers to send with the request.
Custom headers can be used to provide authentication information to the collector which may be required if you are using a hosted collector such as NewRelic, DataDog, or Honeycomb.
These can be configured via the tracing.otlp configuration section.
tracing:
  otlp:
    endpoint: "https://{your-collector-url}"
    headers:
      "X-Some-Header": "some-value"